Current wave data
 Waves have a huge impact on Canterbury's coast and coastal waters. They may be formed by local weather conditions or by weather systems hundreds or even thousands of kilometres away. Wherever they come from, waves are the driving force behind all the changes we see from day to day on the beaches of Canterbury.
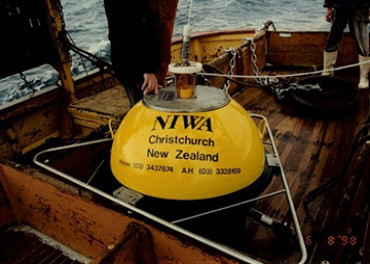
The Canterbury wave buoy is moored in approximately 76 m of water, 17 km east of Le Bons Bay, Banks Peninsula at Latitude 43° 45’ South, Longitude 173° 20’ East. It has been operational since February 1999.
The wave buoy uses a series of onboard sensors and accelerometers to measure the wave height, wave direction and wave period of the waves at this location. It takes a 20-minute sample of the waves every half hour which are then averaged by an onboard computer before being sent through via radio signal to a receiving station at Godley Head every three hours.
Last sample
| Last sample (NZD std time) | Wave Direction (degrees) | Wave Height (m) | Max Wave Height (m) | Wave Period (s) |
|---|---|---|---|---|
| 27-Apr 22:00 | Southerly | 1.21 | 69.999 | 6.8 |
Wave direction
The values shown in this graph are compass bearings from which the incoming waves have arrived at the wave buoy from. North is at 0 and 360 degrees, East is at 90 degrees, South is at 180 degrees and West is at 270 degrees.
Since the wave buoy has been in operation, approximately 60% of the waves have arrived from between south-south-east and south-west (160° – 225°), while due to the sheltering effect of the South Island, only 2% of the waves have arrived from between south-west and north-north-east (225° – 25°).
Wave height
The two lines shown in this graph are the maximum wave height, which is the height of the largest wave that has arrived at the wave buoy during each sampling period, and the significant wave height which is traditionally defined as the mean (or average) of the highest one-third of the waves that arrived at the buoy during that sampling period.
More about the wave height graph
The significant wave height approximates the wave height that an experienced observer (such as a ship’s captain) would describe the waves as, and as this measure is more representative of the waves during a particular period than the maximum wave height, it is more useful and is commonly used by scientists, engineers and hazard management staff.
The mean (average) significant wave height recorded at the wave buoy is 2.1 m, and the highest recorded significant wave height of 8.83 m occurred during a southerly storm in April 2020.
The highest waves recorded at the wave buoy have been 14 m high which is taller than a four-story building. Just over half (54%) of the waves that arrive at the wave buoy are between 1.0 and 2.0 m in height, with a further 32% being between 2.0 and 3.0 m.
Around 8% of the waves that arrive have heights of between 3.0 and 4.0 m, and approximately 3% of the waves are greater than 4.0 m. The remaining approximately 3% of waves have heights of less than 1.0 m.
The background of the wave height graph includes a series of coloured bands which estimate what the likely sea conditions are for a given wave height at the wave buoy.
This information is based on the ‘wind sea’ definition of the Douglas Sea Scale which is used by the World Meteorological Organisation (WMO) and the NZ MetService.
To make viewing easier in this graph, wave heights of less than 1.25 m have been collectively classified as ‘Slight’ as opposed to being divided into ‘Calm’ and ‘Smooth’ as is done in the Douglas Sea Scale.
Douglas Sea Scale
The values of the various categories within the Douglas Sea Scale are shown in the table.
| Sea state code | Wave height (m) | Characteristics |
|---|---|---|
| 0 | 0 | Calm (glassy) |
| 1 | 0 to 0.1 | Calm (rippled) |
| 2 | 0.1 to 0.5 | Smooth (wavelets) |
| 3 | 0.5 to 1.25 | Slight |
| 4 | 1.25 to 2.5 | Moderate |
| 5 | 2.5 to 4 | Rough |
| 6 | 4 to 6 | Very rough |
| 7 | 6 to 9 | High |
| 8 | 9 to 14 | Very high |
| 9 | Over 14 | Phenomenal |
Wave period
Wave period is the time that it takes for a wave to pass a particular point – in our case the wave buoy, and is usually measured from one wave crest to the next crest. It is measured in seconds, and in general, the longer the wave period is, the more energy each wave has.
The mean (average) recorded wave period since February 1999 at the wave buoy is approximately 6.5 s. Overall, approximately 57% of the waves that arrive at the buoy have periods of between 4.0 and 6.5 seconds, 40% have periods between 6.5 and 9.0 seconds, while the remaining approximately 3% of waves have periods greater than 9.0 seconds.

