Surveying Canterbury's urban centres
You may have noticed two small aircraft flying overhead recently. They are undertaking high-resolution aerial surveys of our urban areas and some rural.
Data from the surveys will contribute to better planning around flood and climate resilience. It also helps us provide more accurate land and topographic information to the public.
As part of the Canterbury Aerial Imagery Consortium, made up of Environment Canterbury and the 10 district councils; we have contracted Landpro to carry out two aerial surveys.
What is being captured
The data being captured on these surveys is eight times more accurate than the data we currently have. This allows for greater planning around flood and climate resilience going forward.
LiDAR flight paths
The first survey is a high density aerial (LiDAR) topographic survey of Banks Peninsula. These surveys are captured each year. The LiDAR survey is gathering information on the height of the ground, and above ground features like trees and buildings.
Aerial imagery survey
The second survey aerially photographs Christchurch city and other urban centres in the region. The photography of the urban centres will not be accurate enough to identify individual people.
The urban centres being surveyed span the region, aside from the Kaikōura, Waimakariri and Waitaki districts. Those centres being aerially photographed are:
Hurunui District
- Amberley and Amberley Beach
- Cheviot
- Claverley
- Culverden
- Gore Bay
- Greta Valley
- Hawarden
- Leithfield and Leithfield Beach
- Motunau Beach
- Mt Lyford
- Rotherham
- Waiau
- Waikari
- Waipara
- Hanmer Springs
Christchurch and Banks Peninsula Districts
- Christchurch city
- Lyttelton Harbour
- Akaroa Harbour, including Pigeon Bay and Kukupa
- Little River/Cooptown
- Birdlings Flat
- Little Akaloa
- Okains Bay
- Puari
- Le Bons Bay
- Banks Peninsula rural areas
Selwyn District
- Lincoln
- Prebbleton
- Rolleston
- Darfield
- West Melton
- Springfield
- Hororata
- Sheffield
- Tai Tapu
- Doyleston
- Rakaia Huts
- Lake Coleridge
- Castle Hill village
- Arthurs Pass village
- Waddington
- Glentunnel
- Windwhistle
- Kirwee
- Springston
- Dunsandel
- Southbridge
- Leeston
Ashburton township and rural areas
Mackenzie District
- Tekapo/Takapō
- Twizel
- Albury
- Burkes Pass
- Kimbell
- Fairlie
Timaru District
- Pareora
- Timaru
- Pleasant Point
- Temuka
- Winchester
- Orari
- Geraldine

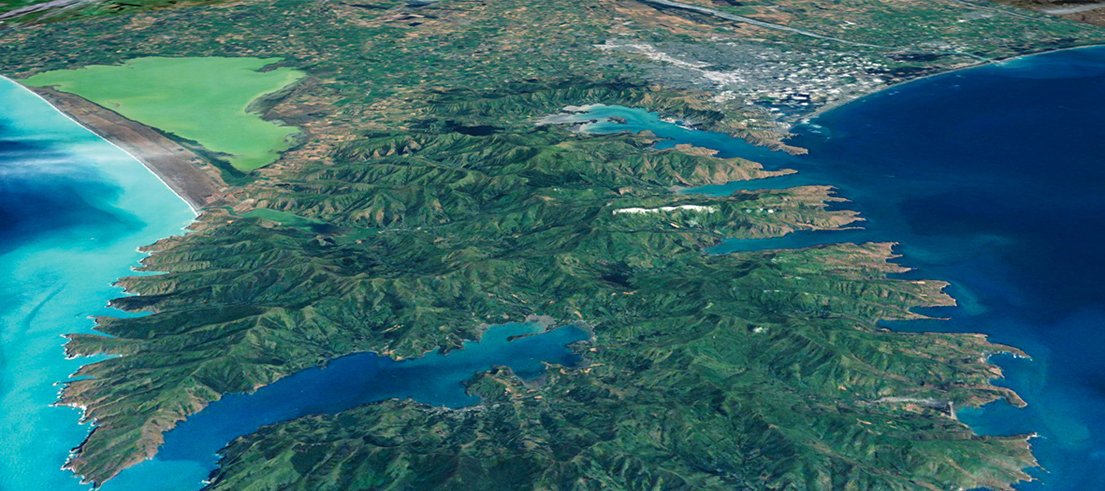
The area over Banks Peninsula to be covered by LiDAR flight paths

Aerial imagery survey of Christchurch and parts of Banks Peninsula
When the flights are happening
Completing these surveys requires a number of flight lines backwards and forwards over the areas being surveyed. To keep the amount of flying to a minimum, operations take place outside commercial airline flight operations times and tidal windows, meaning flights are conducted between 7am and 9pm.
For the topographic flights, the aircraft is required to fly low to capture up to 12 pulse returns per metre for highly accurate topographic mapping of the natural environment, city surfaces and the built environment.
For the aerial photography, flights must occur during the middle part of the day so there are fewer shadows in the photography. It also ensures that commercial flight paths are not disrupted by our work.
The aerial surveys are expected to be completed by 31 March. This project may take longer depending on weather conditions.
We realise this may be an unwelcome annoyance for some, and apologise to anyone our aerial work will disrupt.
The public can view the latest, and historical, aerial photography of your property using the Canterbury Maps property search tool.
What does LiDAR mean?
LiDAR (Light Detection and Ranging) data, or height data, is precise laser measurements of the Earth's surface that is used for creating highly accurate 3D maps of the land.
Having better elevation data is foundational for our scientists to improve geological, flood, coastal natural hazard models, and climate resilience. It provides land information to benefit better planning, and is available to the public via open data on Canterbury Maps.