Transport emissions
 Transport emissions are the fastest growing source of greenhouse gas emissions in New Zealand.
Reducing transport emissions is critical to reducing the effects of climate change, and ensuring New Zealand can meet its targets under the Paris Agreement and the Climate Change Response (Zero Carbon) Amendment Act.
The Regional Transport Committee has set a target of a 30 percent reduction in greenhouse gas emissions from land transport in Canterbury by 2030.
Canterbury's land transport emissions
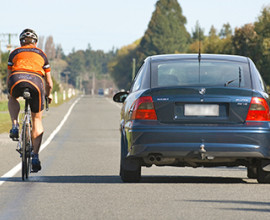
Land transport is a major contributor to Canterbury's greenhouse gas emissions, accounting for 16 percent of our region’s emissions in 2018. Nearly 70 percent of all road transport CO₂ emissions are from light vehicle use (cars, SUVs, utes, vans and light trucks) as opposed to heavy vehicles.
Factors contributing to our transport greenhouse gas emissions
 Canterbury’s vehicle fleet: With an average vehicle age of 16 years old, our fleet is among one of oldest, dirtiest and highest emitting vehicle fleets in the OECD. For more, check out this video on the It’s time, Canterbury website.
- How much we use our cars: Canterbury is currently responsible for 14 percent of New Zealand's vehicle emissions – higher than our share of the national population (12.8 percent). According to the 2018 Census, three-quarters of people drove to work, 8 percent either biked or walked, and only 2.8 percent took the bus.
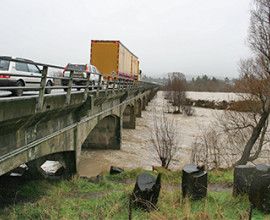
- Freight in most regions is transported by road: A shift in mode to rail or low-emission commercial vehicles would reduce emissions.
 Population growth: More people and more freight movement typically means more transport emissions. Both the land transport system and how we use it needs to change.
- Larger cities and busier roads: This typically means less walking and cycling. More than half of all students get to their place of education by car, truck or van, either as a passenger or by driving themselves. Getting to a place of study or education by car is more common than walking or taking a bus combined.
- Shifting purchasing habits: We’re buying more online, leading to increases in courier deliveries.
Monitoring our transport emissions
Greenhouse gas emissions from road transport in Canterbury are regularly monitored to track progress toward achieving a 30 percent reduction in land transport greenhouse gas (GHG) emissions by 2030.
Despite population growth, emissions from light vehicles such as cars and motorcycles have remained relatively steady. Overall road transport emissions have generally been increasing but decreased in 2019 and 2020. The changing profile of the vehicle fleet in Canterbury and increased vehicle fuel efficiency appears to have been the main contributing factor.
To see emissions for each vehicle type; hover over segments or click 'view full screen'.
To see emissions by fuel type; hover over data points.
Emissions and the impact on our health
Emissions from transport have an impact on the air quality in our region, and on our health.
 Transport emissions are made up of both:
- nitrogen dioxide (NO2): a greenhouse gas that gets into the air from burning petrol and diesel in cars, trucks and buses, and
- particulate matter: (tiny particles of pollutants) that are created by brake and tyre wear and road dust.
These emissions can affect our health both short and long-term. For some, the cumulative effects of exposure to air pollution leads to serious illnesses such as cancer, chronic bronchitis, heart attack, stroke, or death. Vulnerable people (the young, the elderly, and people with existing respiratory conditions) are typically worst affected.
 While emissions of some pollutants have reduced in recent years (due to improved engine technology and fuel quality, or a switch to electric vehicles), many improvements have been offset by higher traffic volumes, more distance travelled, and intensification along transport corridors.
In addition, vehicles are getting heavier, with larger engines.
 The report, released in July 2022, showed that in Canterbury exposure to transport emissions in 2016 contributed to:
- the premature deaths of more than 330 adults
- more than 1,240 hospital admissions for respiratory and cardiac illnesses
- over 1,500 cases of childhood asthma
- approximately 47,000 restricted activity days (days on which people could not do the things they might otherwise have done if air pollution had not been present).
Our region's response
The Regional Transport Committee has targeted a 30 percent reduction in greenhouse gas emissions from land transport in Canterbury by 2030.
Reducing transport-related greenhouse gas emissions is part of our responsibility as kaitiaki, and we have a number of strategies and plans in place to make this a reality, including the following.
 Public transport users: We are focussing on increasing the number of people using public transport, and are supporting this through better accessibility, innovation and affordability. We have committed over $1 billion to operating our public transport network over the next 10 years, with an additional $90 million to support public transport infrastructure.
Decarbonising our bus fleet: Our Metro fleet of electric and low-emission vehicles is growing fast. By 2023, 92 new buses (40 percent of the Metro fleet) will be electric or low-emission vehicles.
 We are a member of the Greater Christchurch Partnership a committee of councils, government agencies and rūnanga with a joint mission to look at the kind of place we want for our future generations.
This includes a low emissions future and investigating mass rapid transport options.

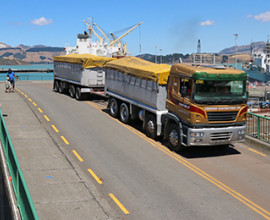
We are working to move more of the region's ever-growing freight task by rail and coastal shipping as well as shift the trucking fleet to zero emissions vehicles.
Both rail and coastal shipping are lower emission modes than road freight.
However, many freight movements cannot be served by rail or coastal shipping, so road freight also has a major role to play.
 We work with local councils in our region to support and promote walking and cycling.
There are now more than 60km of dedicated cycleways in Christchurch, making cycling in the city safer and easier for everyone.
These cycleways are supported by bike parking and electric bike charging options located around the city.
Data is a count of tracked trips that start and finish within five minutes of their scheduled time. Peak travel is between 7am and 9am and 2pm and 6pm. Missed trips are services that did not run due to the likes of driver shortages. Note, we transitioned to a new GPS tracking system in October 2021, which means missed trips are excluded prior to this date.
Data is a count of tracked trips that start and finish within five minutes of their scheduled time. Peak travel is between 7am and 9am and 2pm and 6pm. Missed trips are services that did not run due to the likes of driver shortages. Note, we transitioned to a new GPS tracking system in October 2021, which means missed trips are excluded prior to this date.
Reports
In 2022, the Canterbury Regional Transport Committee commissioned research into people's attitudes towards transport emissions in Canterbury. Please contact us for the full report.
Ways you can reduce transport emissions
We all need to make changes if we want to reduce the impact we have from moving around. Ways in which we can all work together to reduce our greenhouse gas emissions from transport, include:
 Consider taking the bus, a scooter, cycling, or walking for more of your usual trips.
- Working from home a few days a week.
- Choosing to live closer to your main place of work or education.
- Upgrading to a low-emission or zero-emission vehicle.
- Encouraging and supporting others to shift their behaviour. (The 'avoid', 'shift', 'reduce' framework is a useful reference.)
These also have the added benefit of improving health and wellbeing.
For more ideas, watch the 'It's time, Canterbury' video about what you can do to make a difference.
Further information and resources
- It's time, Canterbury climate change website
- Ministry of Business, Innovation & Employment: NZ energy sector greenhouse gas emissions
- Ministry for the Environment: Our air 2021
- Ministry for the Environment: NZ's Interactive Emissions Tracker
- Ministry of Transport: Climate Change emissions work programme
- Ministry of Transport: Quarterly fleet statistics
- Energy Efficiency & Conservation Authority: Vehicle Emissions and Energy Economy Labelling Programme
- StatsNZ: Greenhouse gas emissions (industry and household) – year ended 2020
- Study: Health and Air Pollution in NZ summary report (PDF File)